Blue wall crumbled, Michigan is a swing state again. Maps show how it evolved

- A key part of the ‘blue wall’ of Democratic support, Michigan is once again politically unpredictable
- Since 2000, 37 counties consistently go Republican, while only seven counties reliably supported Democrats
- Once-Democratic counties like Bay and Arenac are now Republican strongholds, but no county has shifted from solid Republican to Democratic
The blue wall crumbled for Democrats this week, just two years after the party seized control of all branches of government in Michigan in 2022.
In giving President-elect Donald Trump his second victory in three tries, Michigan voters backed a Republican for the sixth time since 1976, making it a certifiable swing state where the GOP has just a good a shot as Democrats.
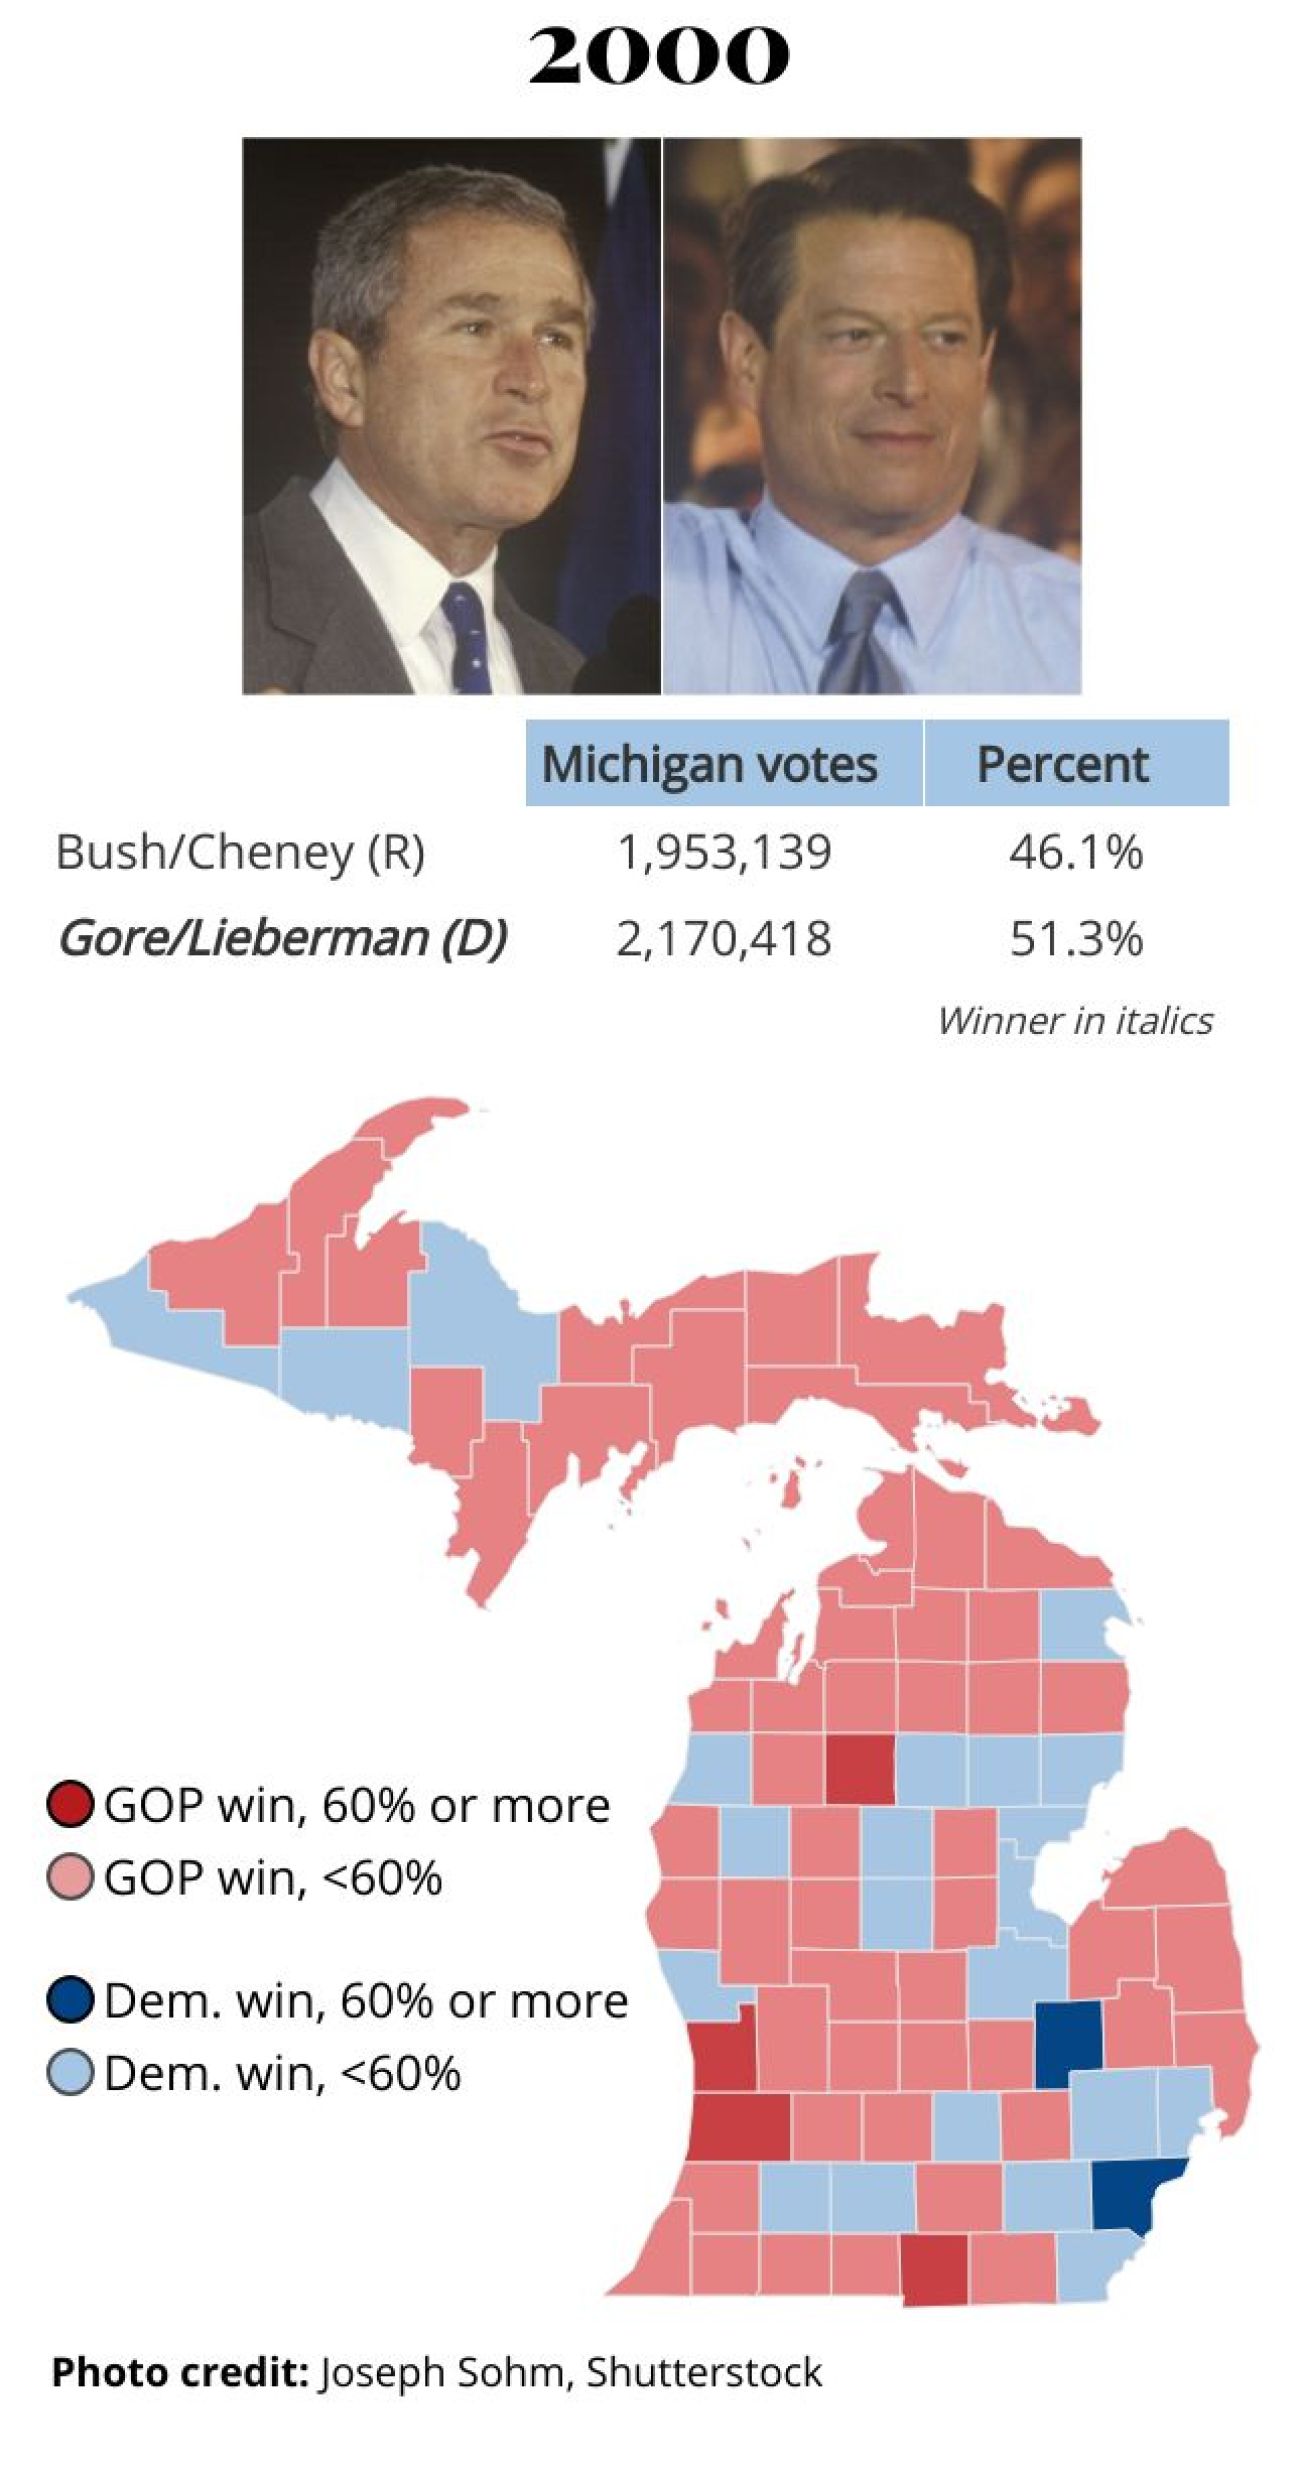
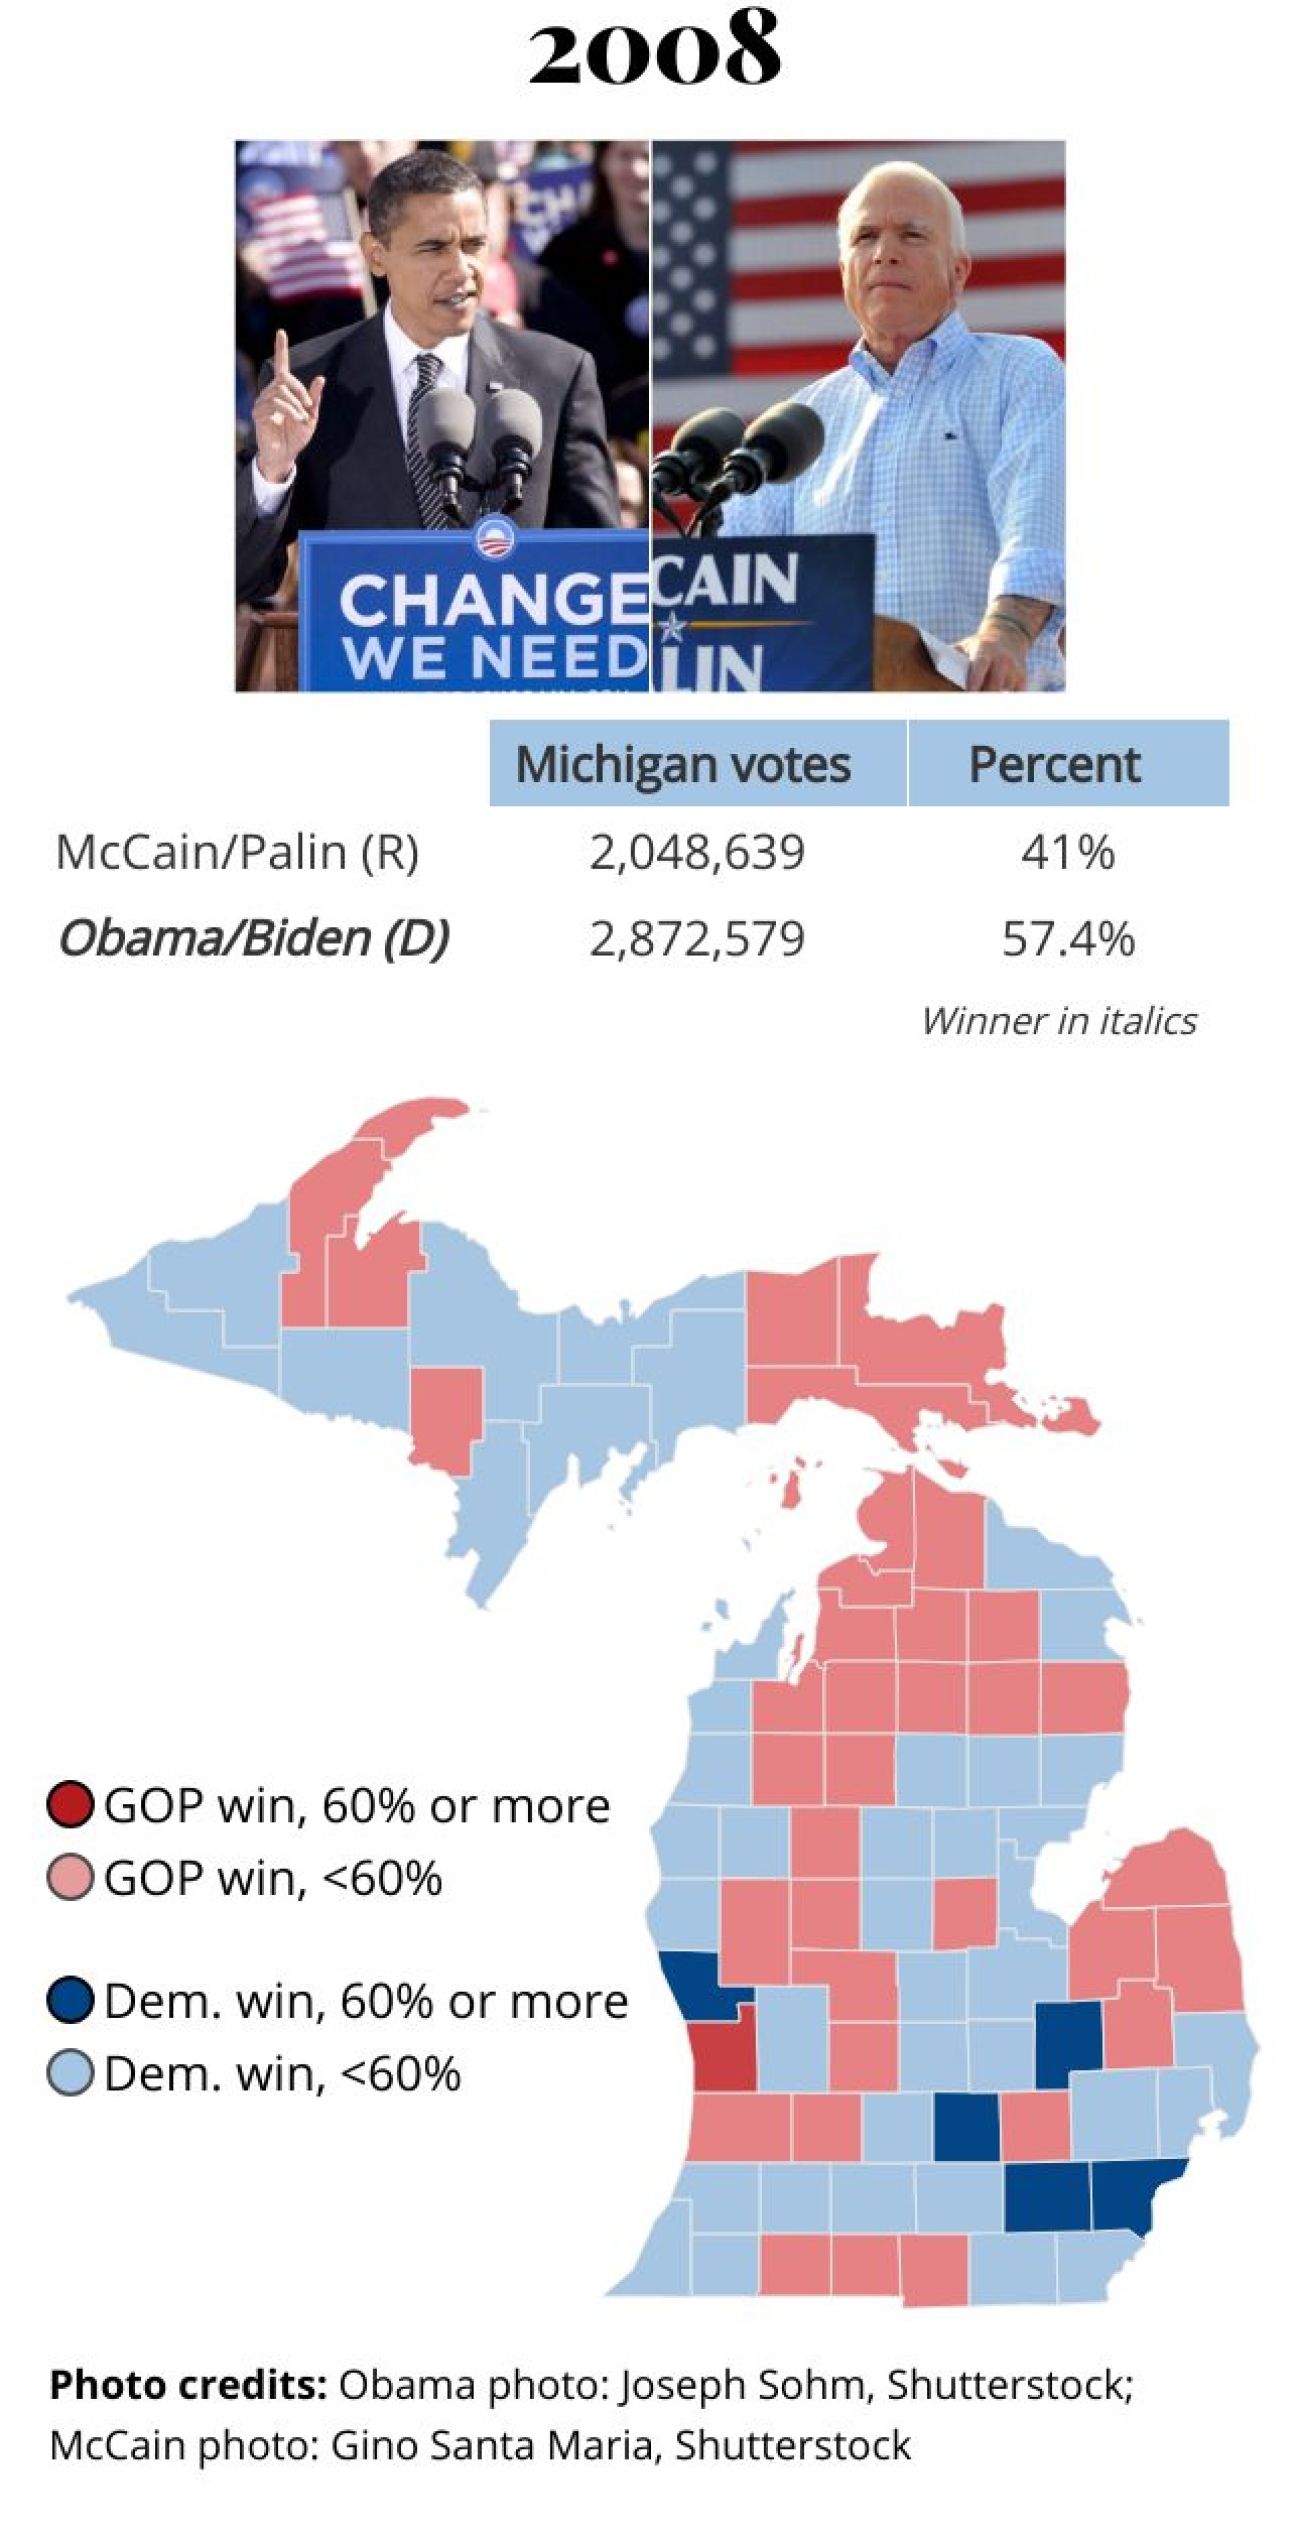
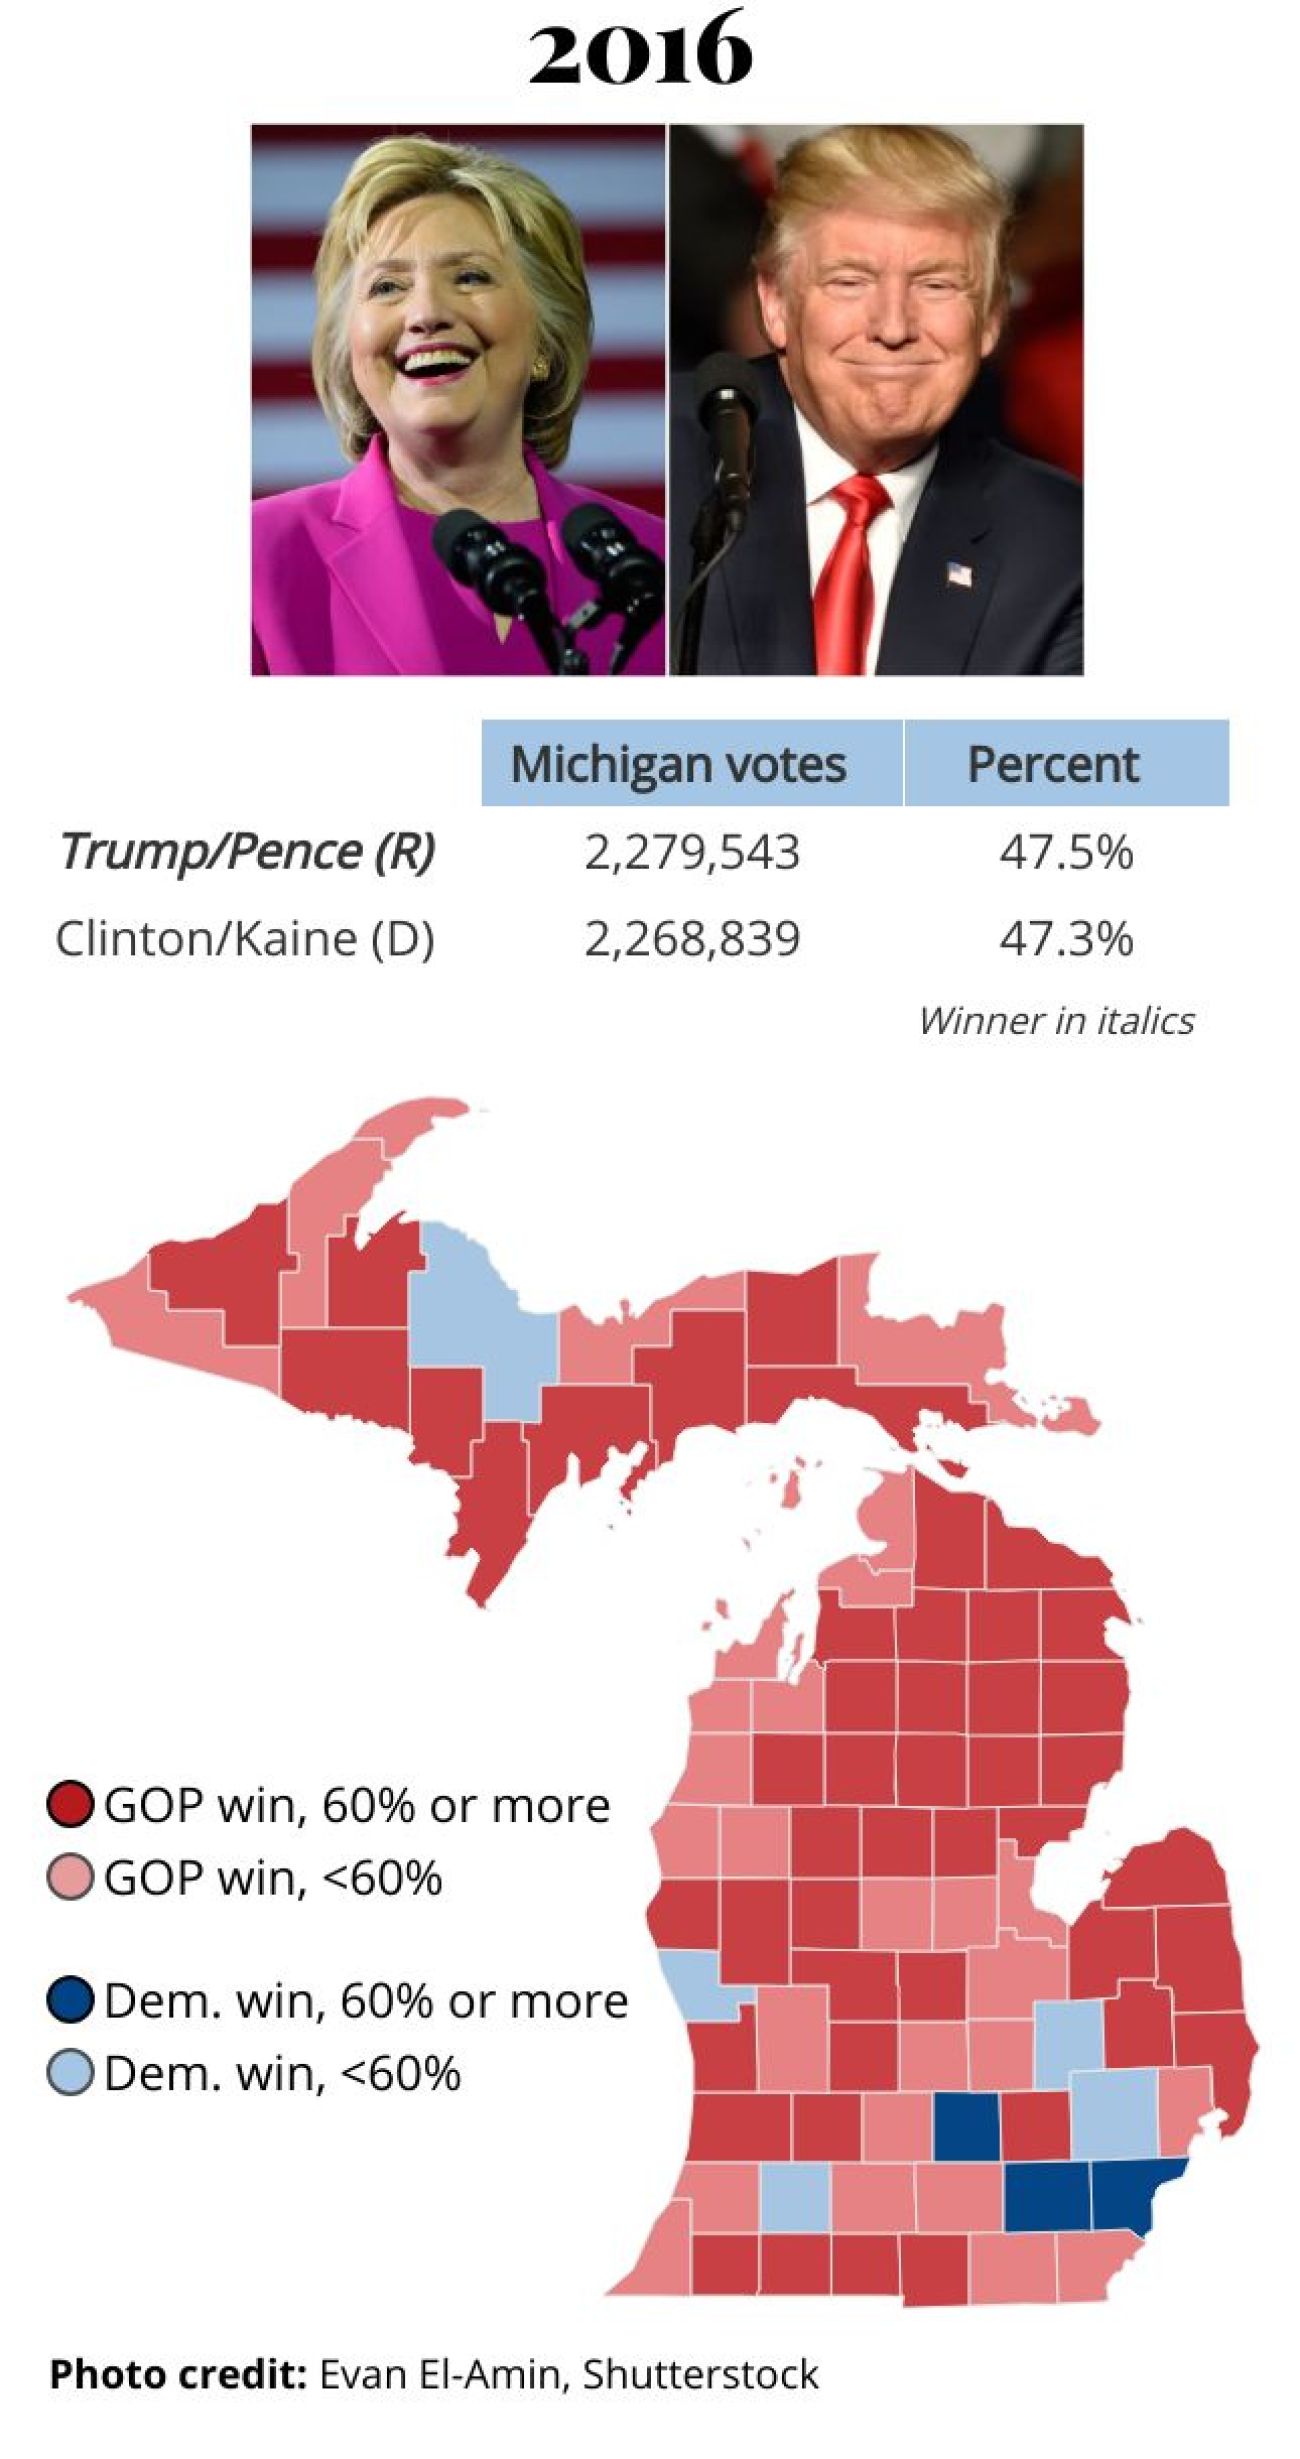
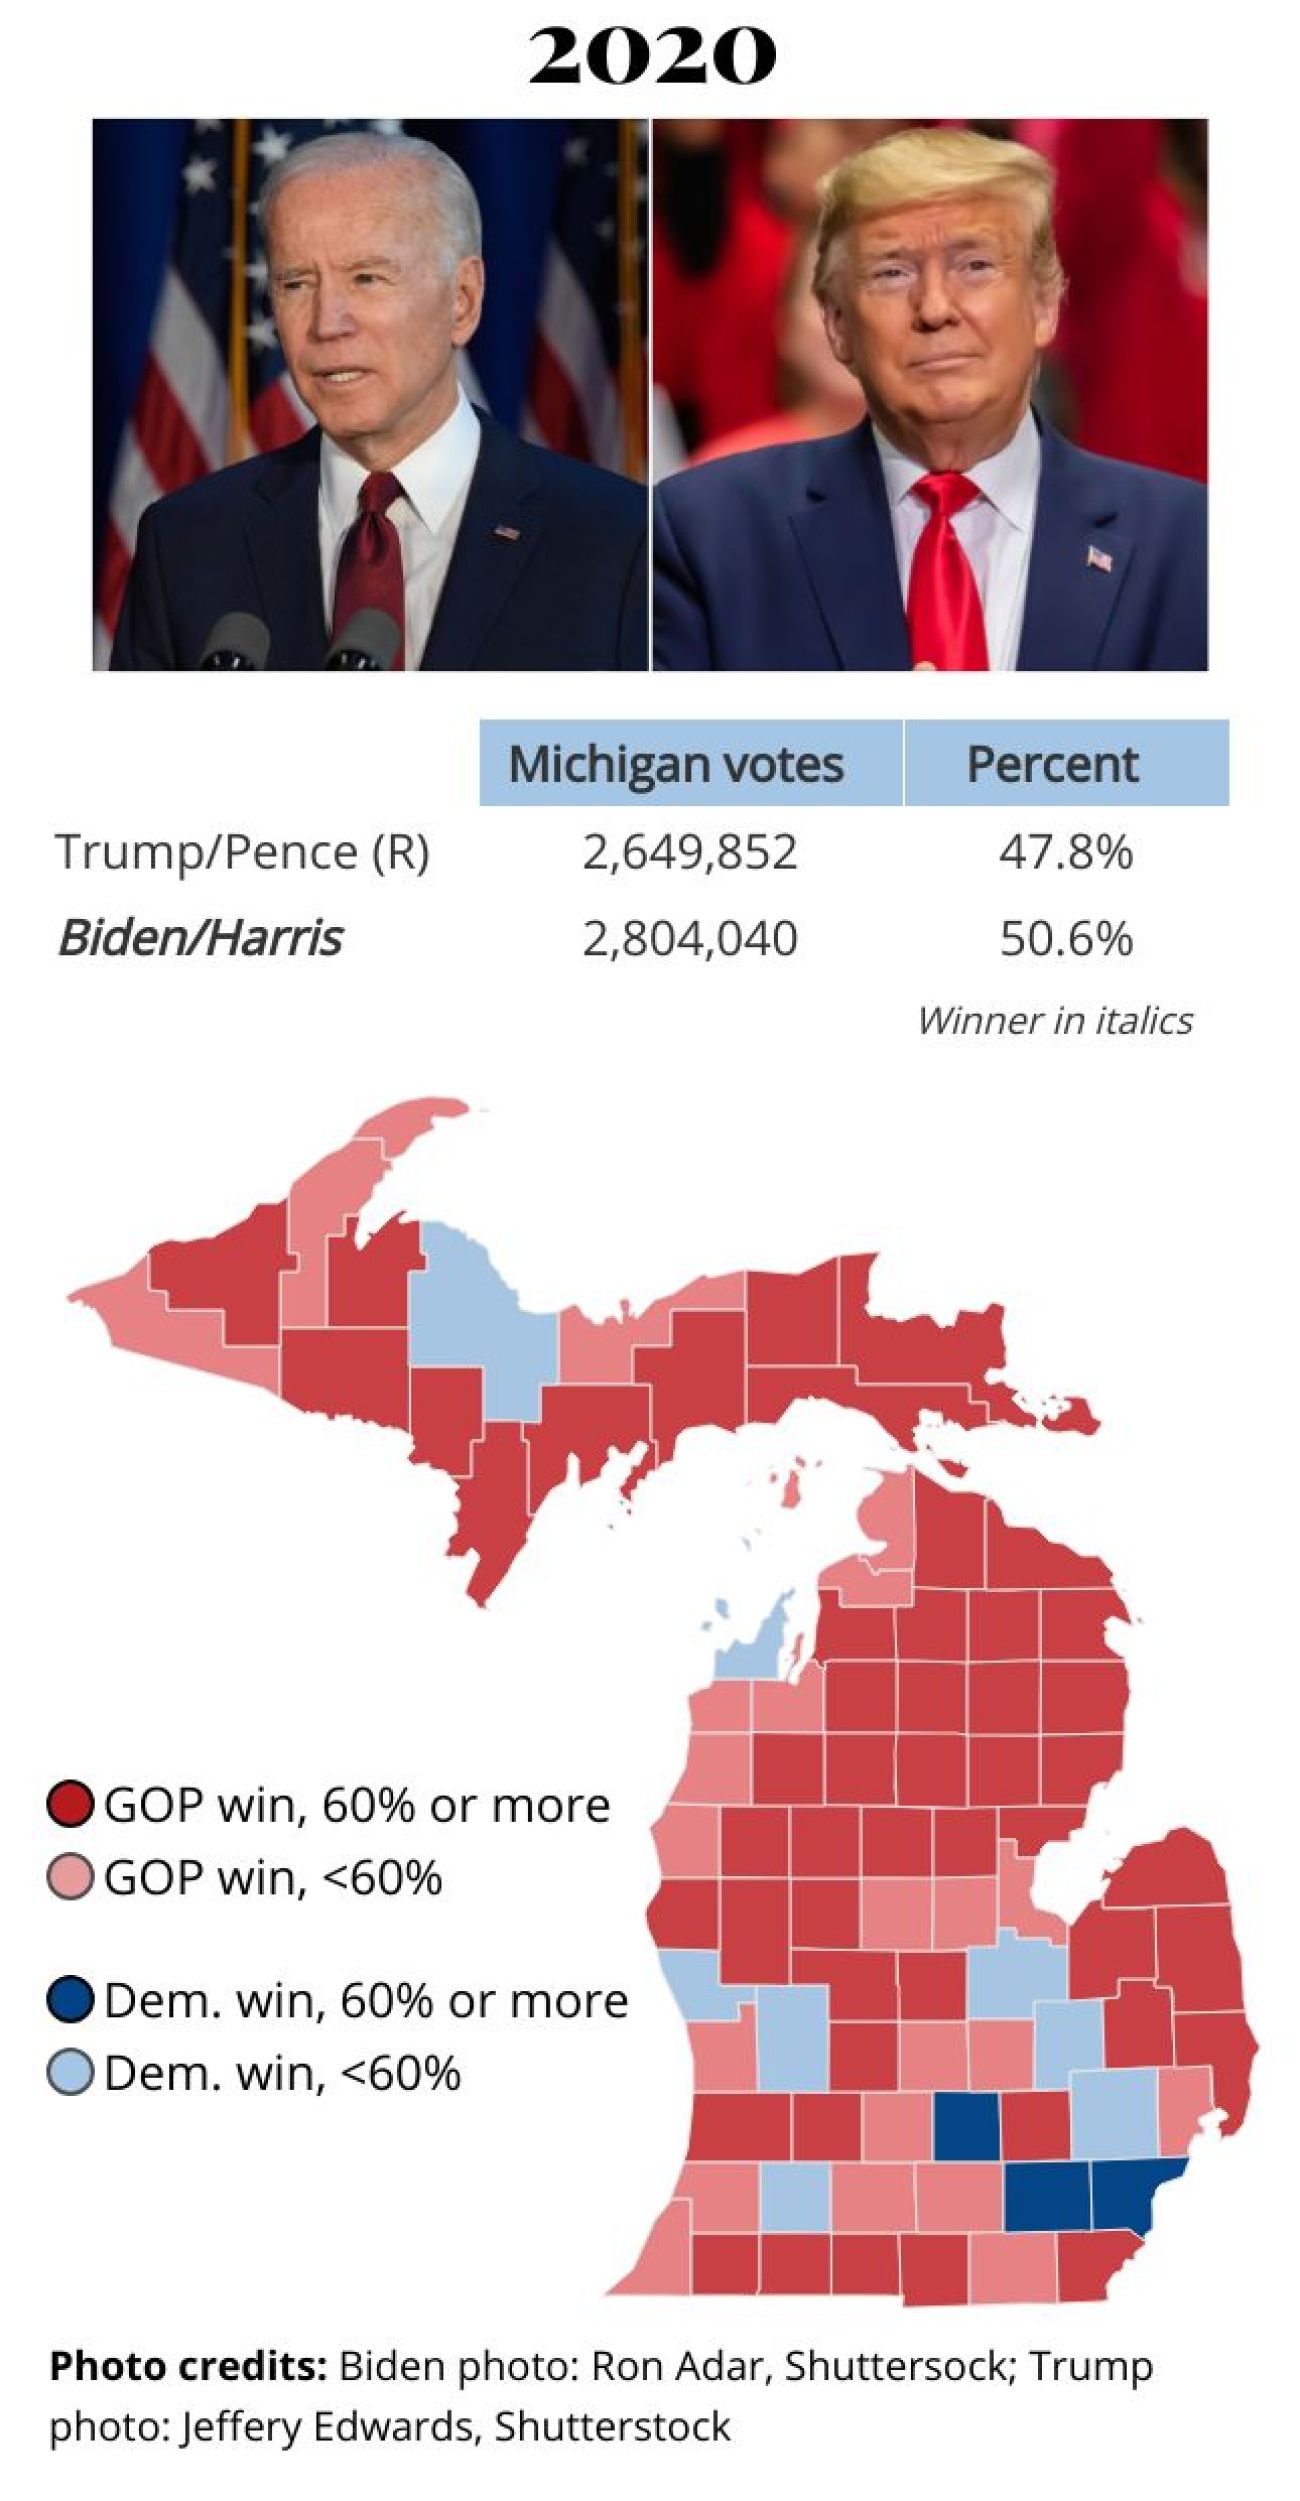
Take 2008, for instance. President Barack Obama won 46 counties in the state, including eight in the Upper Peninsula and 13 counties in northern Michigan.
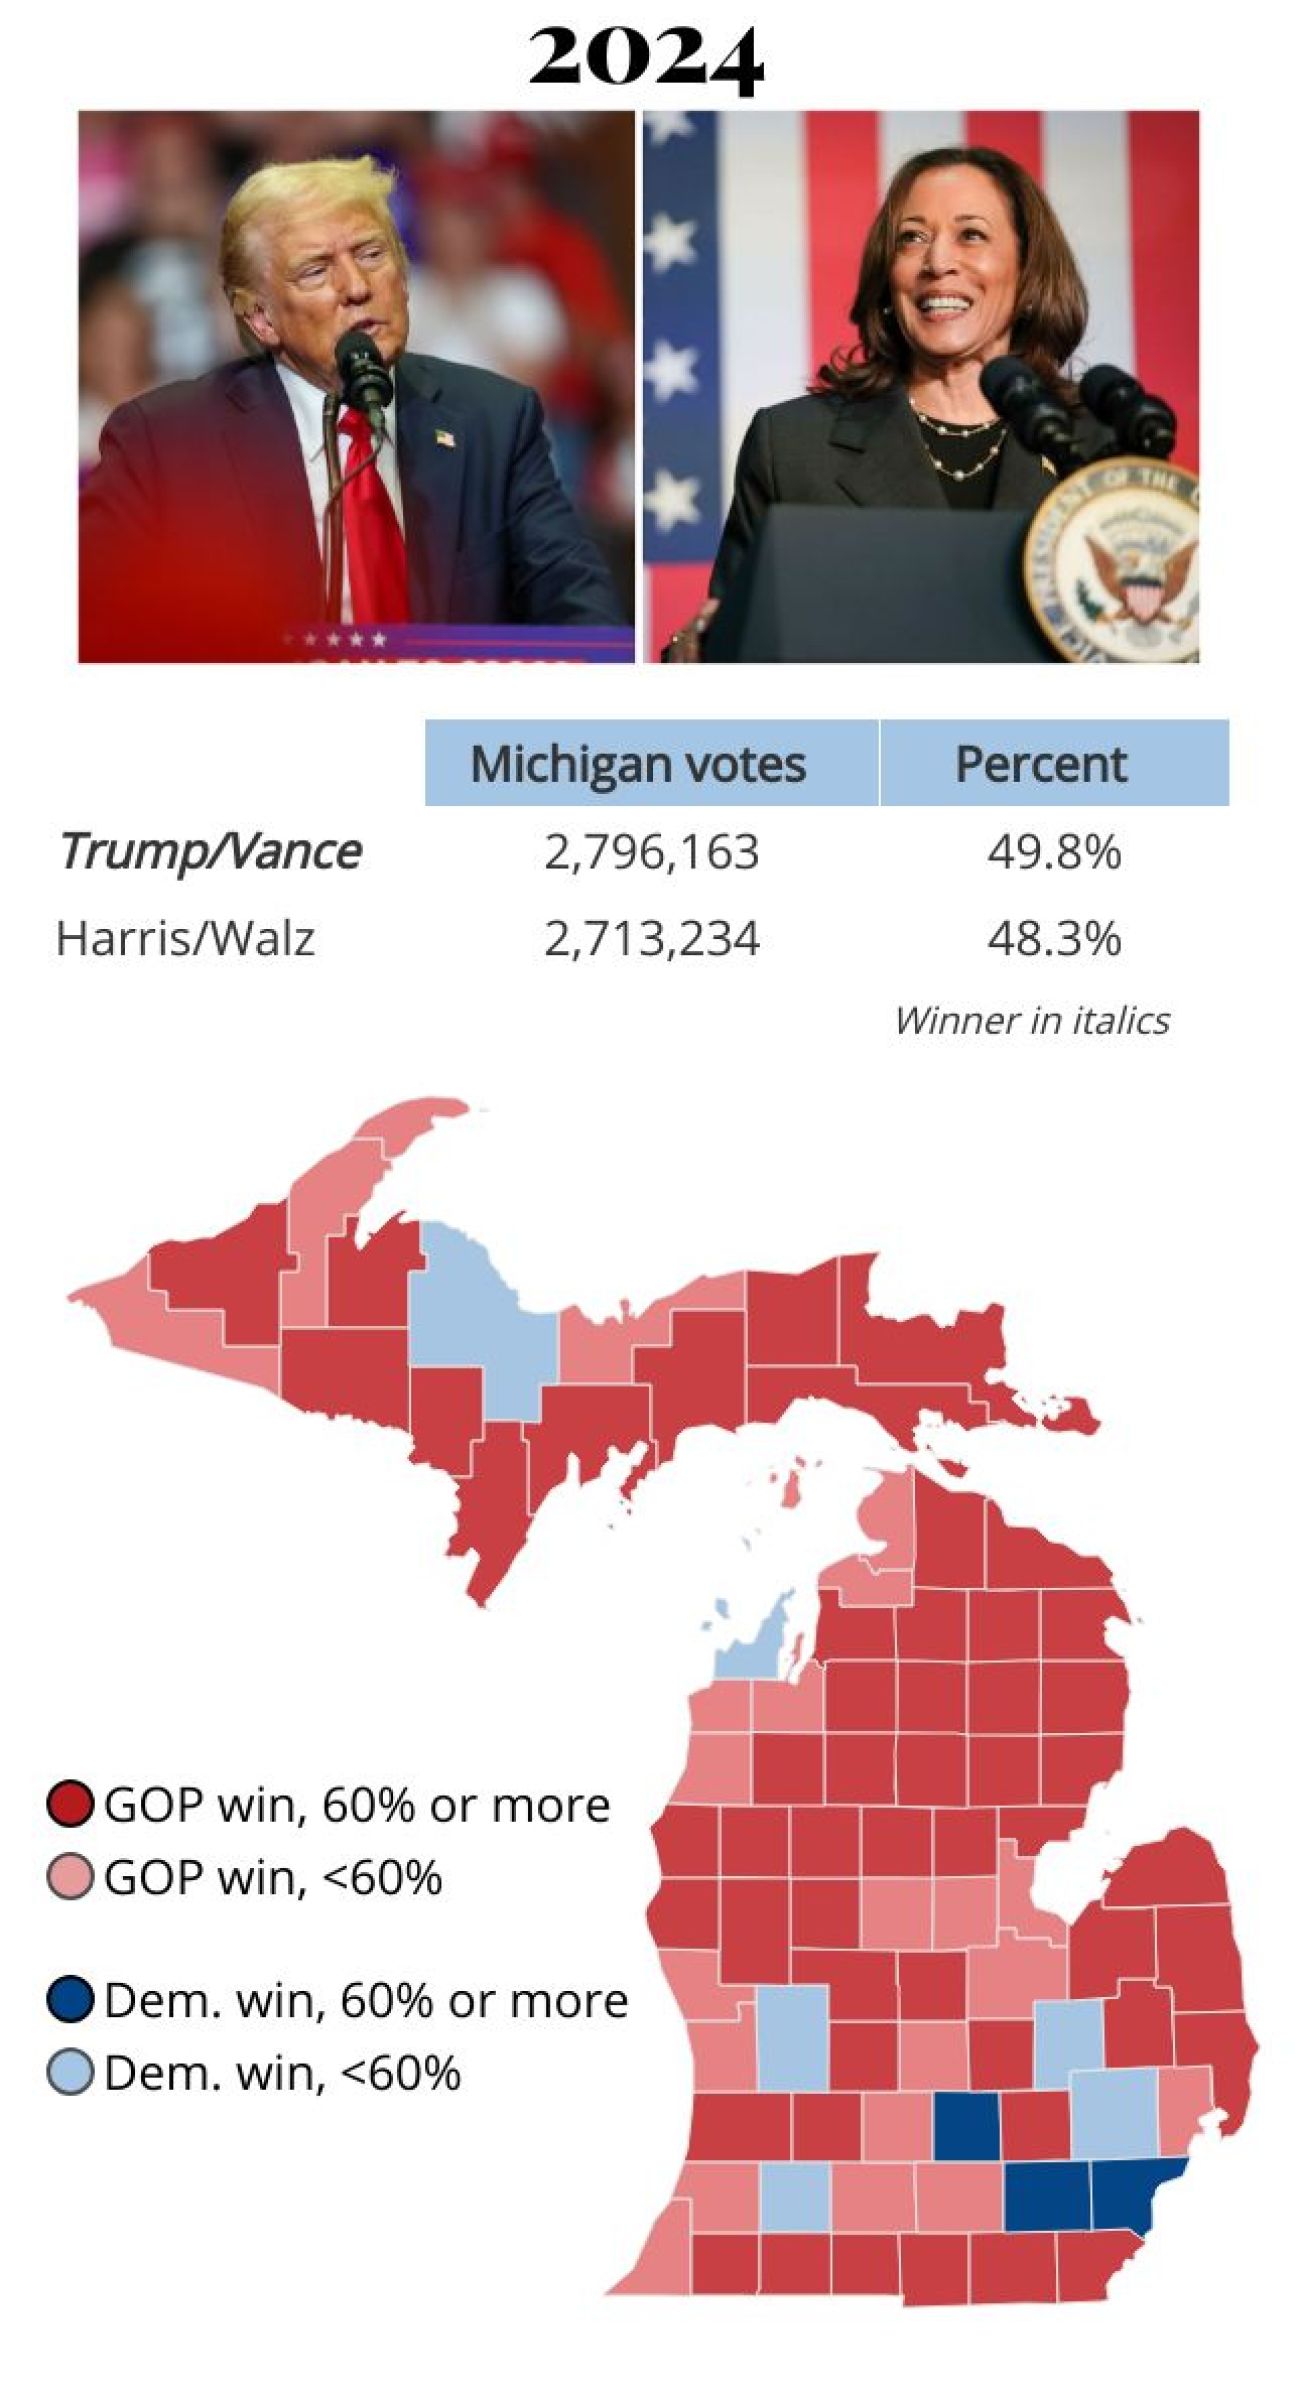
But on Tuesday, Democrats saw a more red-tinged map: Only two counties north of central Michigan backed Vice President Kamala Harris: Leelanau and Marquette.
Trump won all but nine counties and flipped two, Saginaw and Muskegon.
Related:
- Michigan’s political geography is shifting. These interactive maps show how.
- Donald Trump’s path to victory in Michigan: Expand support nearly everywhere
Michigan voted for a Republican in 1976, 1980, 1984 and 1988 before backing President Bill Clinton, a Democrat, in 1992 and 1996. And it supported Democrats in 2000, 2004, 2008 and 2012.
Not all of Michigan has swung, however.
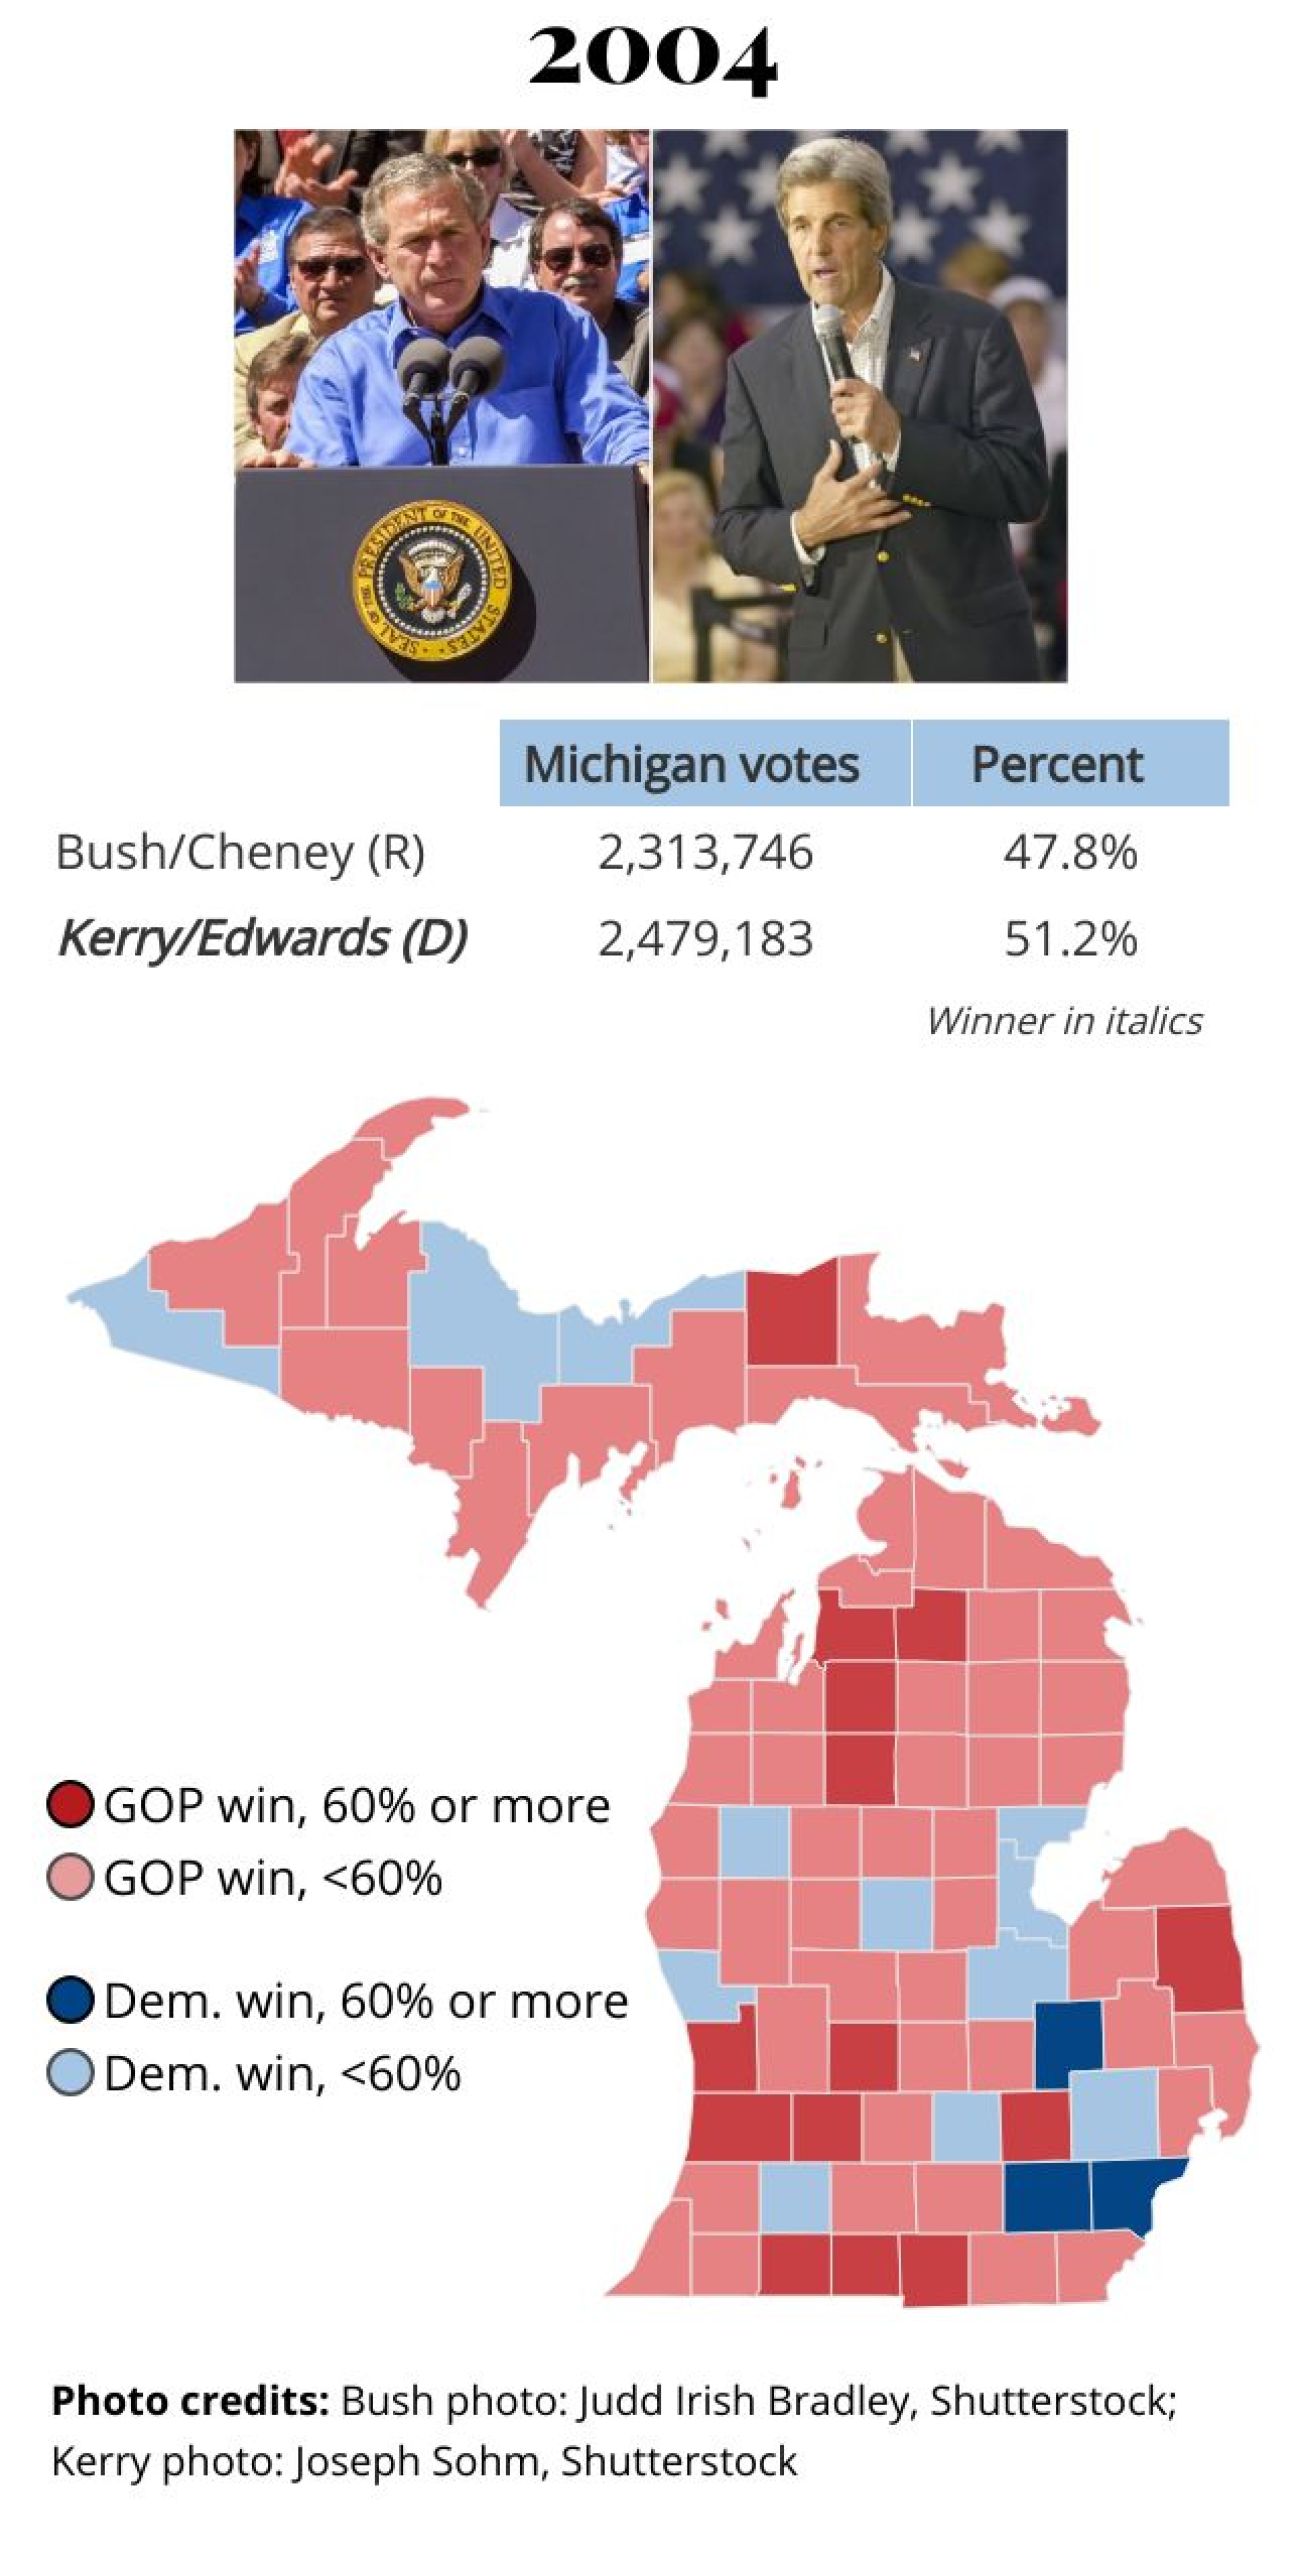
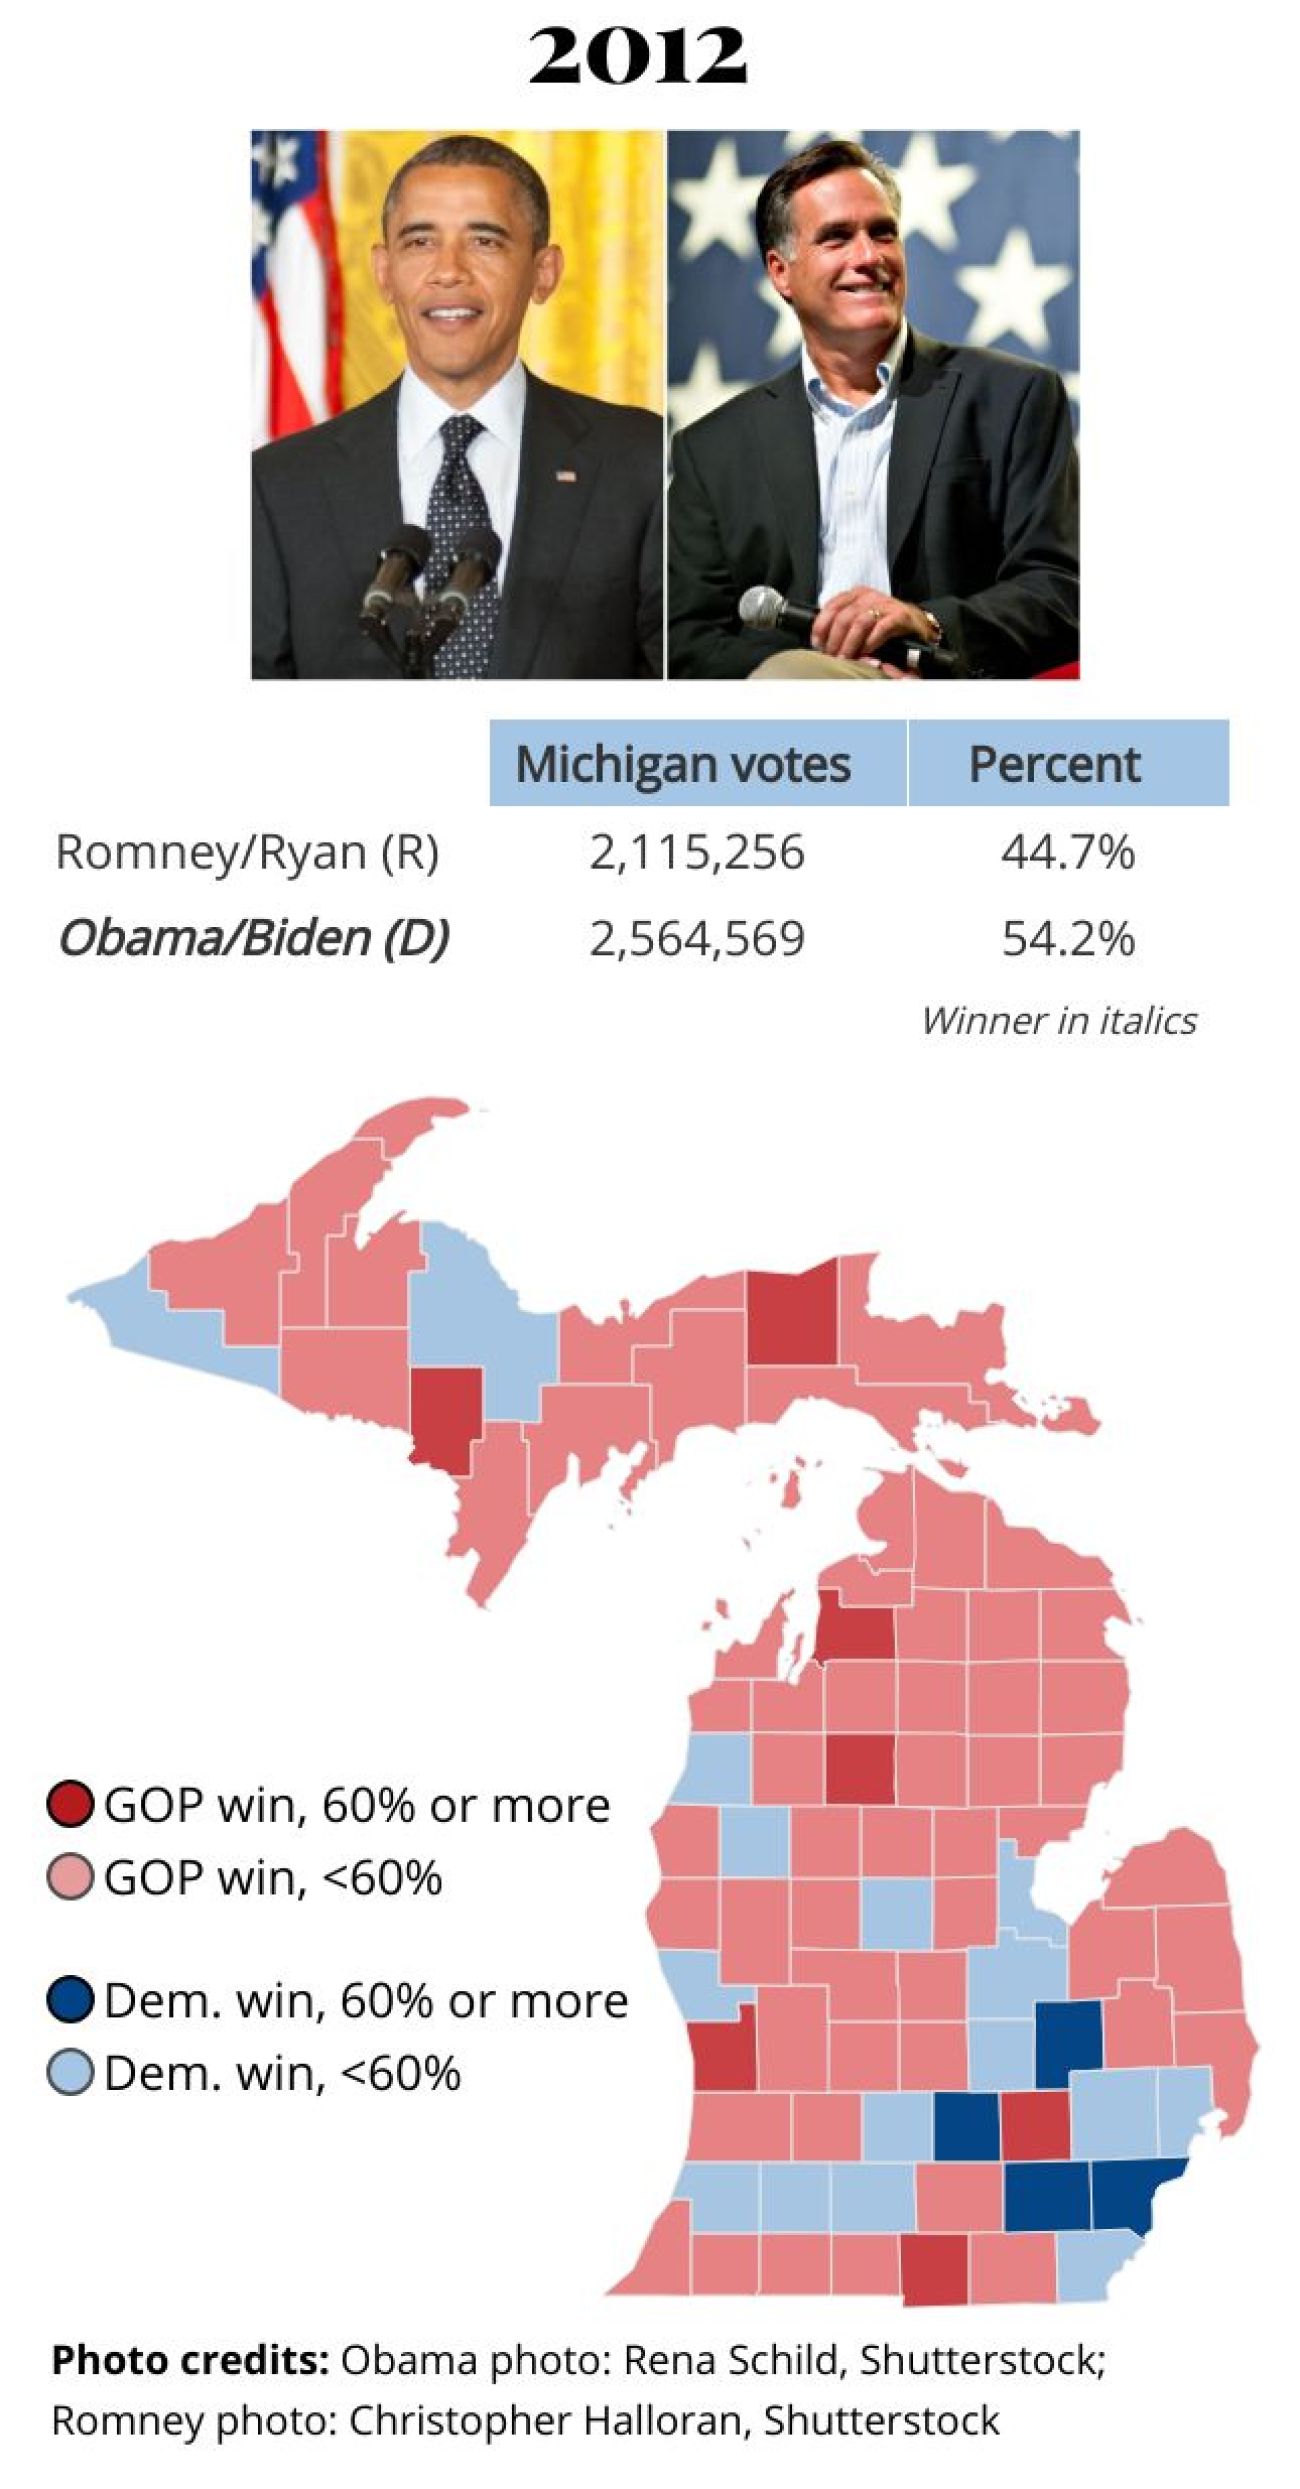
Voters in 37 counties always backed Republican candidates in the last seven elections since 2000, while just seven counties always voted for a Democrat: Wayne, Oakland, Washtenaw, Ingham, Kalamazoo, Genesee and Marquette.
Some counties that were once solidly Democratic are now solidly Republican, including Bay, Arenac, Isabella, Lake and Gogebic.
No county was solidly Republican and flipped to solidly Democratic since 1976.
The partisan map of Michigan has changed dramatically in the past two decades, with Democrats having a smaller geographic footprint.
In northern Michigan, working-class Alpena County backed Democrat Al Gore in 2000 and Obama in 2008 and gave Republicans tiny victories in 2004 and 2012.
But since then, Republicans have gotten at least 62% of Alpena County votes. Trump got 64% on Tuesday.
Below, scroll through the county-level results from 2000 through Tuesday. Some years may shock you.
See what new members are saying about why they donated to Bridge Michigan:
- “In order for this information to be accurate and unbiased it must be underwritten by its readers, not by special interests.” - Larry S.
- “Not many other media sources report on the topics Bridge does.” - Susan B.
- “Your journalism is outstanding and rare these days.” - Mark S.
If you want to ensure the future of nonpartisan, nonprofit Michigan journalism, please become a member today. You, too, will be asked why you donated and maybe we'll feature your quote next time!


